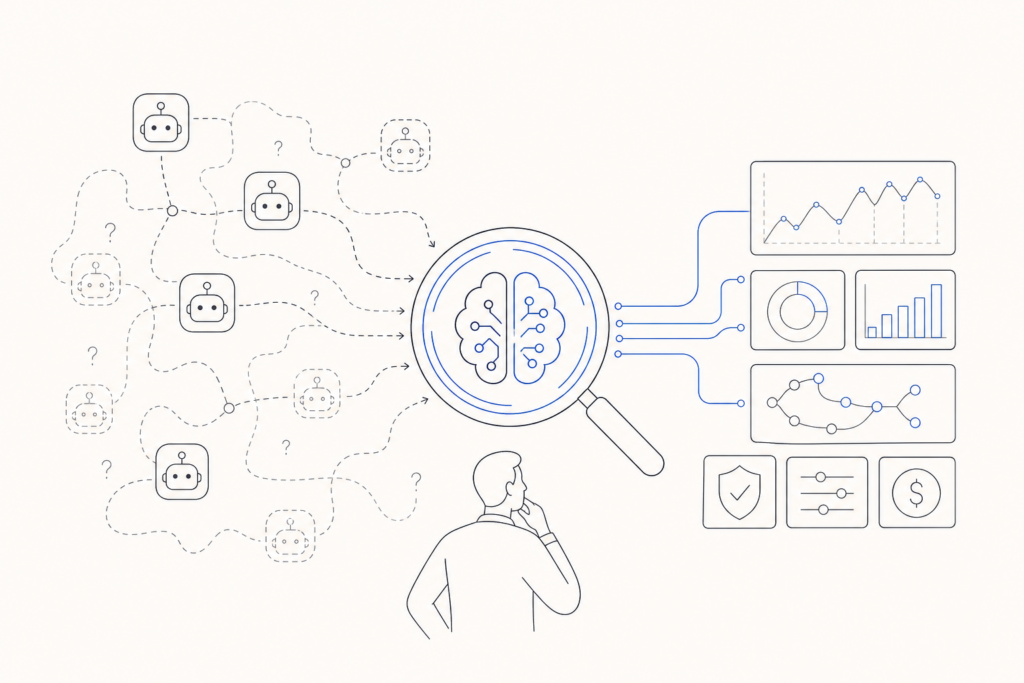
An AI-powered observability platform gives engineering and security teams real-time visibility into LLM calls, agent decisions, and token costs. To choose the right one in 2026, audit your current agent footprint, define your telemetry requirements, evaluate open-source versus SaaS tradeoffs, test integrations, and validate runtime control capabilities before committing.
Most enterprises already have more AI agents running than anyone officially approved. Monitoring coverage has not kept pace, and the gap between what is deployed and what is visible creates real risk: compliance failures, runaway token costs, and agent behavior no one can explain after the fact. This guide walks you through a five-step selection process, covering audit, requirements, deployment model, tool evaluation, and runtime validation, to close that gap.
Why AI Powered Observability Platform Adoption Has Become a Board-Level Priority in 2026
AI observability is no longer an engineering concern that lives in a backlog. It has moved to the boardroom because the cost of ignoring it is now measurable.
According to New Relic's 2026 report, one in four AI agents are deployed in production without any monitoring or runtime visibility. That same report found that 82.6% of engineering leaders agree the increasing use of AI-generated code makes reliable observability critical for software stability. When agents write code, call external APIs, and make decisions autonomously, a missing trace is not just a debugging inconvenience. It is a compliance liability.
The market reflects that urgency. Mordor Intelligence reports the market for agentic AI monitoring and observability tools was valued at USD 0.55 billion in 2025. The Business Research Company projects the LLM observability platform market will reach $2.69 billion in 2026, growing at a CAGR of 36.3%. That growth is driven by enterprises trying to answer a basic question: what are my agents actually doing?
LLM-based systems produce signals that traditional APM tools were never built to handle: prompt chains, tool call sequences, token budgets, and model drift over time. Standard OTLP exporters, for example, often drop tool call parameters entirely, and any custom schema mapping you write to compensate can break when a model provider updates its API response format. For a deeper look at what agent-level visibility requires, the AI agent observability overview covers the core concepts in detail.
Step 1: Audit Your Current AI Agent Footprint
Before you evaluate any platform, you need an accurate count of what you are actually monitoring. Most enterprises cannot produce one.
Splunk's 2026 research found that 87% of organizations prioritize AI monitoring, yet 54% have failed to tie these practices to clear business outcomes. One reason: teams monitor the agents they know about while shadow agents, those spun up by individual teams or through low-code tools, operate outside any visibility layer entirely.
Follow these steps to build a complete inventory before you shortlist any platform:
- Pull a list of every API key issued to AI services across your cloud accounts and identity provider. Keys issued to OpenAI, Anthropic, Azure OpenAI, and similar services indicate an active or recently active agent, whether or not it appears in any official registry.
- Scan your CI/CD pipelines and container registries for LangChain, AutoGen, Copilot Studio, or Databricks runtime signatures. These frameworks leave identifiable artifacts even when the agents themselves are undocumented.
- Interview team leads in engineering, data science, and operations separately. Ask each group to list the AI tools they use, not the ones they have approval for. The gap between those two lists is your shadow agent surface.
- Check your network egress logs for outbound calls to model inference endpoints. Unrecognized or undocumented endpoints often indicate agents that bypassed the approval process entirely.
- Document each discovered agent with its owner, purpose, data access scope, and current monitoring status. Agents with no owner or no monitoring status are your highest-priority gaps.
New Relic's 2026 data confirms that one in four production agents have no runtime visibility at all. An audit that surfaces even a fraction of those agents before you select a platform will directly shape which telemetry capabilities you need most. A platform built for ten sanctioned agents is a different purchase than one built for forty, including the fifteen nobody approved.
Step 2: Define Your Telemetry and Cost Requirements
Knowing what you need to observe is a prerequisite for evaluating any platform. Without a requirements list, vendor demos will show you what each tool does best, not what your environment actually needs.
Start with signal types. AI agent environments produce at least four distinct telemetry categories: LLM traces (prompt, completion, latency, model version), tool call logs (which external APIs an agent called and with what parameters), cost signals (token consumption per model, per agent, per session), and behavioral drift indicators (changes in output patterns over time). Not every platform captures all four. Know which ones are non-negotiable before your first vendor call.
Cost is a real constraint, not just a line item. A Futurum Group survey of 628 IT leaders found that 36% expect to spend over $1 million on observability solutions in 2026. Much of that spend is driven by telemetry storage volume. High-frequency LLM tracing at scale generates large data volumes, and platforms that charge by ingestion volume can produce bills that grow faster than the agent fleet they monitor.
Map your requirements against these four questions before shortlisting:
- Which signal types does your compliance framework require you to retain, and for how long? HIPAA and the EU AI Act have different retention and audit trail requirements. Your platform needs to match the stricter one.
- What is your current OpenTelemetry maturity? If your stack already exports OTLP traces, a platform with native OpenTelemetry support will instrument faster and with less custom code than one that requires a proprietary SDK.
- How many models and frameworks do you need to cover? A team running only OpenAI calls has simpler needs than one running LangChain agents that call Databricks models and external MCP servers in the same workflow.
- What is your acceptable latency for trace data? Near-real-time visibility costs more to store and process than batch telemetry. Decide whether you need alerts within seconds or summaries within minutes before comparing platform architectures.
Step 3: Evaluate Open-Source vs. SaaS Deployment Models
For most enterprise teams, the open-source versus SaaS decision comes down to three factors: where your data can live, how much operational overhead your team can absorb, and how quickly you need to be up and running.
Open-source observability tools give you full control over data residency. If your compliance posture requires that LLM traces and prompt content never leave your own infrastructure, an open-source deployment running in your cloud account is the cleaner path. You own the storage, the retention policy, and the access controls, along with the operational burden of upgrades and scaling.
According to Grafana Labs' 2026 observability survey, 77% of respondents said open source and open standards are important to their observability strategy. That preference is strong, but it does not mean open-source is always the right operational choice. A team without dedicated platform engineering capacity will spend more time keeping the tool running than using it.
SaaS platforms shift that operational burden to the vendor. You get managed scaling, automatic updates, and a support tier. The cost is that telemetry data, including prompt content and agent decisions, travels to and is stored on infrastructure you do not own. Teams subject to strict data sovereignty rules need to review where the vendor's data centers are located and what their subprocessor agreements cover.
Coralogix sits in this space as a managed monitoring platform. It stores data in the user's own cloud object storage through what it calls a telemetry lake, which gives teams more data residency control than a fully hosted SaaS model while still offloading infrastructure management. Per modern-datatools.com, data can be temporarily blocked if daily quotas are reached without pay-as-you-go settings configured, and unused subscription units expire at term end. The user interface has also been reported as difficult to navigate on smaller screens, per trustpilot.com.
The practical decision framework: if your security team requires data to stay in a specific region or cloud account, start with open-source or a hybrid model like Coralogix. If your team lacks the capacity to manage infrastructure and your compliance requirements allow vendor-hosted storage, a fully managed SaaS platform will get you to production faster.
Step 4: Which Observability Tools Support Multi-Model LLM Monitoring?
The best AI-powered observability platform for your environment is the one that covers your actual model and framework mix, not just the most common use case. Most tools handle single-model OpenAI tracing well. The gaps show up when you run multiple models, autonomous agents, or workflows that chain tool calls across frameworks.
Here are three tools worth evaluating at this stage, each with a distinct approach.
Cognee takes a different angle from standard trace collectors. Rather than capturing ephemeral LLM calls, it builds a persistent knowledge graph and vector index from unstructured data, including chat histories and documents, to give AI agents long-term memory across sessions. This matters for observability when you need to understand not just what an agent did in a single session but what context it was drawing on. Per agentsystems.blog and memverdict.com, knowledge graph construction runs between 11 and 22 seconds per chat in tests, and extraction prompts require manual tuning for specialized domains. LLM extraction during ingestion also adds token costs that compound at scale.
Coralogix covers APM, infrastructure monitoring, and AI telemetry through a unified platform. Its telemetry lake model means trace data lands in your own cloud storage rather than the vendor's, which matters for teams with strict data residency requirements. As noted in Step 3, quota management requires attention to avoid data gaps.
OpenLIT is built around OpenTelemetry-native tracing for AI agents, with support for cost tracking and GPU utilization alongside standard LLM traces. Per docs.openlit.io, it offers zero-code instrumentation for production Python applications, meaning you can add tracing without modifying application code. It also automatically redacts sensitive data from telemetry before it leaves your stack, which reduces the compliance surface for teams handling regulated data.
That 92% of practitioners see value in AI-assisted anomaly detection within observability platforms, per Grafana Labs' 2026 survey, signals that multi-model coverage is becoming a baseline expectation rather than a premium feature. When evaluating any platform, ask specifically which model providers are supported natively, whether coverage extends to open-source models like Llama or Mistral, and how the tool handles agent frameworks that call multiple models in a single workflow.
Step 5: Instrument Your Stack and Validate Runtime Controls
Instrumentation is where selection decisions become real. A platform that looks complete in a demo can still require weeks of integration work before it produces useful signal in your environment.
Follow these steps to move from evaluation to a validated production setup:
- Start with a single, well-understood agent. Pick one agent with a defined purpose and known data access scope. Instrument it first so you have a baseline before you scale to the full fleet.
- Initialize manual instrumentation in your AI application to begin producing OpenTelemetry traces [S4]. If your chosen platform supports zero-code instrumentation for Python, use that path first to reduce the initial integration surface. OpenLIT supports this approach per docs.openlit.io.
- Confirm that every trace captures the four signal types from Step 2: LLM call details, tool call logs, token costs, and behavioral indicators. A trace that captures latency but drops tool call parameters is incomplete for compliance purposes.
- Test your data redaction and masking rules before any sensitive data enters the telemetry pipeline. Prompt content can contain PII. Verify that redaction runs before export, not after storage.
- Run a controlled drift test. Change the system prompt or model version for your instrumented agent and confirm the platform detects and surfaces that change. Drift detection that only works in documentation is not drift detection.
- Validate that your alerting rules fire on real conditions. Set a token budget threshold and deliberately exceed it. If the alert does not fire within your acceptable latency window from Step 2, the alerting configuration needs adjustment before go-live.
Runtime guardrails deserve specific attention. Many platforms surface what an agent did after the fact. Fewer enforce constraints on what an agent can do in the moment. Before you sign a contract, test whether the platform can block a tool call, not just log it. That distinction separates passive monitoring from active control, and it matters more as agent autonomy increases.
When Should You Add a Dedicated AI Agent Security Layer?
Observability platforms tell you what happened. A security layer determines what is allowed to happen.
That distinction matters most when agents operate autonomously, call external tools, or handle regulated data. Passive monitoring captures a prompt injection attack in the logs. Active enforcement stops the agent from completing it. New Relic's 2026 report found that 82.6% of engineering leaders agree that AI-generated code makes reliable observability critical for software stability. Once you close the visibility gap, the next question is whether visibility alone is sufficient for your risk profile.
An agent that has been traced and logged can still exfiltrate data, call an unauthorized API, or act outside its intended scope, and you will only know after the fact. If your environment includes agents handling PHI, financial records, or any data covered by the EU AI Act, post-hoc logging is a compliance gap, not a compliance control.
Trust3.ai is an AI agent security platform that addresses this gap. It discovers every agent running in your environment, including shadow agents that bypassed any approval process, traces every prompt, tool call, and decision in real time, and enforces purpose-based access controls so agents can only act within their authorized scope. The output is a full audit trail, drift detection, and compliance evidence for regulations like the EU AI Act and HIPAA.
The practical signal for when to add this layer: if your Step 5 runtime control validation showed that your observability platform can log a guardrail violation but cannot block the underlying action, you have a monitoring tool, not a security control. Teams running agents with write access to production systems, external API credentials, or sensitive data stores typically need both.
Prices and plan limits verified as of October 2026.
FAQs
How does knowledge graph memory differ from traditional RAG in observability?
Knowledge graph memory, as used by tools like Cognee, builds a persistent graph of entities and relationships from ingested data that agents can query across sessions, rather than retrieving isolated document chunks at query time. For observability, this means you can trace not just what an agent retrieved but what long-term context shaped its decision, which matters when auditing agent behavior over time.
What are the cost drivers for AI-powered observability in 2026?
The main cost drivers are telemetry storage volume, ingestion pricing models, and LLM extraction overhead. High-frequency tracing of large agent fleets generates significant data, and platforms that charge by ingestion volume scale costs with your fleet size. A Futurum Group survey of 628 IT leaders found that 36% expect to spend over $1 million on observability solutions in 2026. Token costs from knowledge graph construction and AI-assisted anomaly detection add a second layer of variable expense.
Which platforms offer zero-code instrumentation for AI agents?
OpenLIT offers zero-code instrumentation for production Python applications, per docs.openlit.io, meaning you can add OpenTelemetry-native tracing without modifying application code. This reduces the initial integration burden and lowers the risk of instrumentation errors in production. Not all platforms support this approach. When evaluating options, ask specifically whether zero-code instrumentation covers your agent framework and model provider, or whether it applies only to direct API calls.
What compliance frameworks do AI observability platforms typically support?
Most enterprise-grade platforms produce audit trails and retention controls that can be mapped to GDPR and CCPA requirements. Coverage for newer frameworks like the EU AI Act and HIPAA varies. The EU AI Act requires explainability and human oversight evidence for high-risk AI systems, which means your platform needs to capture decision context, not just latency and error rates. HIPAA adds data handling and access logging requirements. Verify specific framework support with each vendor before shortlisting.
How do I monitor shadow AI agents I did not deploy myself?
Start with the audit process in Step 1: review API keys issued to AI services, scan container registries and CI/CD pipelines for known framework signatures, and check network egress logs for calls to model inference endpoints. Shadow agents leave traces in identity systems and network logs even when they appear in no official registry. Platforms with agent discovery capabilities can automate parts of this scan across cloud accounts and identity providers.
Conclusion
Choosing an AI-powered observability platform in 2026 is a five-step process: audit what is running, define your telemetry and cost requirements, decide between open-source and SaaS deployment, evaluate tools against your actual model and framework mix, and validate runtime controls before go-live. The right platform surfaces every agent, every tool call, and every token cost in real time, and produces the audit trail your compliance framework requires.
Once you have visibility, check whether your platform can enforce constraints, not just record violations. If your agents handle regulated data or have write access to production systems, passive monitoring leaves a gap that logging alone cannot close. The concrete next step is to run the Step 1 audit against your own environment: pull your API keys, scan your pipelines, and compare that list against what your current monitoring covers. The size of that gap tells you exactly what kind of platform you need.
Related Articles