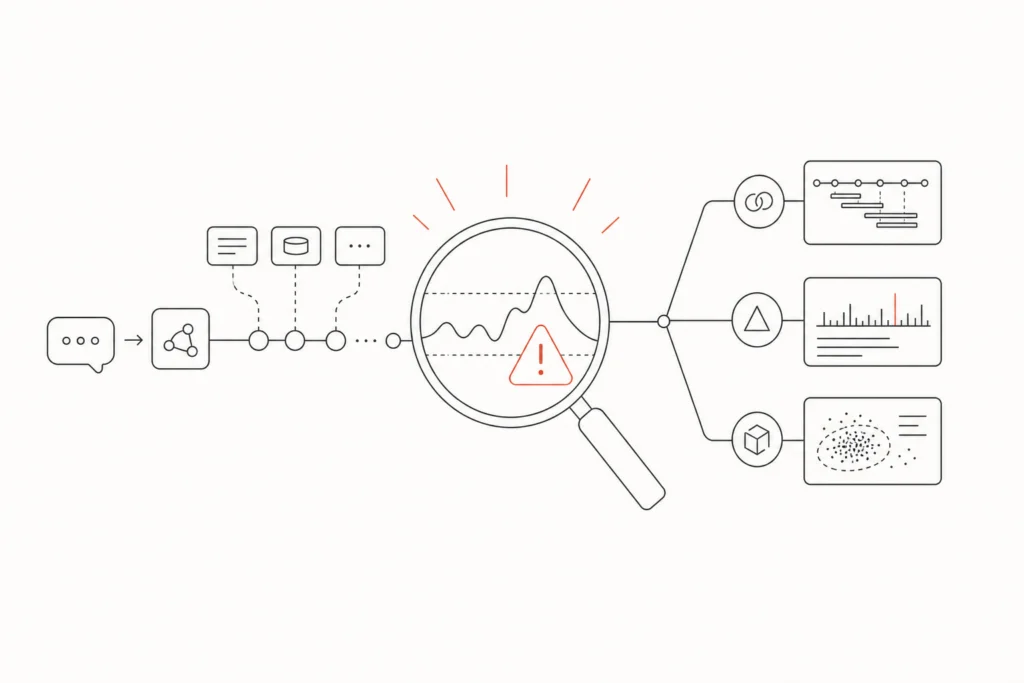
The three LLM monitoring tools best suited to catching model failures fast are Langfuse, Sentry, and Dynatrace with Arize AX. Langfuse leads on open-source prompt tracing and evaluation, Sentry extends existing error monitoring to cover AI agent failures, and Dynatrace pairs full-stack root-cause analysis with specialized LLM tracing through Arize AX. Each tool fits a different deployment model, so the right pick depends on your team’s infrastructure, budget, and how deep into agent behavior you need to see.
Unmonitored LLM deployments carry real operational risk. A New Relic report found that 24.6% of organizations deploy autonomous AI agents with no monitoring or runtime visibility at all. That gap grows more costly as agents take on more decisions. The three tools below each address a distinct failure-detection use case, so you can match a tool to your situation before reading the full breakdown.
How to Choose an LLM Monitoring Tool
Picking the right tool starts with three questions: Where does your model run? Who owns the infrastructure? What counts as a failure for your team?
Open-source vs. proprietary. Open-source tools give you full control over data residency and let you inspect the code. Proprietary tools trade that control for managed infrastructure, faster setup, and vendor support. Neither is universally better. If your compliance requirements restrict where traces can be stored, self-hosted open-source is often the only viable path.
Self-hosting vs. cloud. Self-hosting keeps data inside your perimeter but adds operational overhead: you manage upgrades, storage, and uptime. Cloud-managed deployments reduce that burden but introduce a dependency on the vendor’s availability and data handling policies. Teams with lean platform engineering capacity often find cloud the pragmatic default, at least to start.
What to evaluate. Look for these capabilities before committing to any tool on this LLM monitoring tools list:
- Prompt tracing and span-level visibility into agent decisions
- Evaluation workflows, including both LLM-as-a-judge scoring and deterministic code checks
- Cost attribution per user, feature, or workflow
- Integration with your existing frameworks (LangChain, LlamaIndex, custom agents)
- Retention policies that match your audit or debugging needs
Only 52% of IT leaders trust AI systems to perform fully autonomous remediation, per a 2026 Grafana Labs survey. That low confidence is partly a monitoring problem: teams cannot trust what they cannot see. Reading about agent observability as a discipline before selecting a tool helps you define what “seeing enough” actually means for your deployment.
Start with your failure modes. If your biggest risk is silent quality degradation, prioritize evaluation pipelines. If it is production errors surfacing in user-facing features, error monitoring integration matters more. If it is cost overruns across a multi-service architecture, full-stack attribution is the deciding factor.
LLM Monitoring Tools at a Glance
According to The Business Research Company’s 2026 report, the market for monitoring LLM applications reached $1.96 billion in 2025, reflecting how quickly production deployments have outpaced the tooling built to watch them.
| Tool | Deployment | Core Strength | Price Tier | Best For |
|---|---|---|---|---|
| Dynatrace (Arize AX) | Cloud | Full-stack root-cause analysis + LLM tracing | Premium | Large enterprises with complex multi-service environments |
| Langfuse | Cloud or self-hosted | Prompt management, evaluation, open-source tracing | Budget | Teams that need open-source control and prompt experimentation |
| Sentry | Cloud or self-hosted | AI agent tracing inside existing error monitoring | Budget | Teams already using Sentry for application performance monitoring |
1. Langfuse: Open-Source LLM Observability and Prompt Management
Langfuse specializes in prompt management, evaluation workflows, and agent tracing, with an MIT-licensed core that you can self-host entirely inside your own infrastructure. That open-source foundation is the main reason teams with strict data residency requirements choose it over cloud-only alternatives.
What it traces. Langfuse captures spans across multi-step agent runs, linking each tool call, retrieval step, and model response into a single trace. You can see exactly which prompt version triggered a failure, how long each step took, and what the model returned at every node. This span-level visibility is what makes LLM tracing open source practical for debugging rather than just logging.
Prompt management. Langfuse includes a built-in prompt registry where you version prompts, run experiments, and compare outputs without leaving the platform. Annotation queues let your team label traces for quality review, feeding those labels back into evaluation workflows. The Pro plan retains raw trace history for three years, which matters when you need to audit how a prompt behaved months after a deployment.
Evaluation. Langfuse supports both LLM-as-a-judge scoring, where a second model grades outputs against a rubric, and code-based checks, where you write deterministic functions to flag specific failure patterns. Running both in parallel gives you coverage that neither approach provides alone. LLM-as-a-judge catches nuanced quality issues; code checks catch structural failures reliably and cheaply.
When self-hosting makes sense. If your organization cannot send prompt data or model outputs to a third-party cloud, Langfuse’s MIT-licensed core removes that constraint. You manage the deployment, but you own every byte of trace data. For teams with the platform engineering capacity to run it, this is a meaningful advantage. Langfuse suits teams building prompt-heavy applications who want a structured experimentation and evaluation loop alongside their tracing.
Limitations to weigh. The cloud-managed version sits at a budget-tier price point, making it accessible for smaller teams. Self-hosting shifts cost from subscription fees to infrastructure and maintenance. Validate current feature availability directly with Langfuse before committing to a production rollout, since documentation from a single source may not reflect recent changes.
2. Sentry: AI Agent Tracing Inside Your Existing Error Monitoring Stack
Sentry integrates AI agent tracing into the same platform your team already uses for application errors and performance monitoring. If Sentry is already in your stack, adding LLM visibility requires no new vendor relationship, no separate dashboard, and no duplicate alerting setup.
What it adds for AI agents. Sentry captures spans across AI agent runs and links them to the surrounding application context, so you can see whether a model failure caused a broader user-facing error or whether an upstream application bug triggered a bad prompt. That connected view is harder to get when your LLM monitoring lives in a separate tool. Agent tracing is available on every Sentry plan.
Where it fits the developer workflow. Sentry’s strength is familiarity. Error grouping, release tracking, and performance traces all carry over to AI agent spans. A team debugging a production failure does not need to context-switch into a purpose-built LLM tool; the agent trace appears alongside the stack trace they already know how to read.
Adoption signal. A 2026 Stack Overflow developer survey found that Sentry is the most used tool for AI agent observability at 26%. That figure reflects adoption within a specific developer survey sample, not a universal ranking across all enterprise deployments, but it does indicate strong familiarity among engineering teams.
Limitations to weigh. Full-fidelity spans are retained for only 30 days by default, which limits post-incident analysis beyond that window. The self-hosted version does not include the Seer AI investigation feature, so teams that run Sentry on their own infrastructure lose that automated triage capability. Advanced AI investigation requires a pricier add-on per contributor. Sentry is a practical choice for teams that want LLM tracing without adopting a separate observability product, but teams with deep prompt experimentation needs may find its evaluation tooling limited compared to a dedicated tool.
3. Dynatrace with Arize AX: Full-Stack Observability for Enterprise LLM Deployments
Dynatrace pairs full-stack infrastructure monitoring with Arize AX’s specialized LLM tracing to give large organizations a single place to correlate model failures with the services, databases, and APIs surrounding them. This combination suits enterprises where an LLM failure is rarely isolated: it ripples across pipelines, microservices, and user-facing products simultaneously.
Davis AI and root-cause analysis. Dynatrace’s Davis AI engine continuously analyzes telemetry across your entire environment and surfaces probable root causes automatically. When a model starts returning degraded outputs, Davis can correlate that signal with a database slowdown, a downstream API timeout, or a spike in token consumption, without requiring a human to manually join those data sources. That automated correlation is what separates Dynatrace from tools that surface symptoms but leave diagnosis to the engineer.
Arize AX and LLM-specific tracing. Arize AX handles the model-specific layer: tracing prompts, completions, tool calls, and retrieval steps using OpenInference and OpenTelemetry standards. Those open standards mean you are not locked into a proprietary trace format, and your traces remain portable if your observability stack changes. For enterprises running Anthropic, OpenAI, or local models inside a complex architecture, that portability matters.
Cost and complexity. Dynatrace sits at a premium price tier, and per techradar.com and g2.com, implementation typically takes one to three months. The learning curve is steep for smaller teams, and the pricing structure adds complexity at scale. Cisco’s Splunk report found that 55% of organizations cannot effectively control AI costs due to usage complexity, and Dynatrace’s pricing can contribute to that problem if not scoped carefully before deployment.
When it is the right fit. Elastic, scalable LLM observability across a multi-service enterprise environment is where this combination performs best. If your team already runs Dynatrace for infrastructure monitoring, adding Arize AX extends that investment into the model layer without rebuilding your observability stack from scratch. Teams without existing Dynatrace infrastructure should weigh the onboarding timeline against the depth of visibility they actually need.
How Do These Tools Handle LLM Hallucination Detection?
None of the three tools detects hallucinations directly. Each provides an evaluation framework that lets your team define what a hallucination looks like for your specific application, then flag outputs that match that definition.
LLM-as-a-judge scoring. Langfuse and Arize AX both support LLM-as-a-judge workflows, where a second model scores each output against a rubric you define [T1, T2]. You specify what a good answer looks like, and the judge model assigns a score. This approach catches nuanced quality failures, including factual drift, off-topic responses, and confident-but-wrong answers, that deterministic checks cannot reliably identify. The tradeoff is cost and latency: every output requires a second model call.
Code-based checks. Langfuse also supports deterministic evaluation functions. You write a check that looks for specific patterns, such as a response that contradicts a known fact in your context window, and flag any trace that triggers it. These checks run fast and cheaply, but they only catch failures you anticipated when writing the function.
Sentry’s approach. Sentry does not offer a built-in evaluation pipeline for output quality. It surfaces errors and performance anomalies in agent spans, so it can tell you that a model call failed or took too long, but it does not score whether the response was factually correct. Teams using Sentry as their primary monitoring tool typically pair it with a separate evaluation layer for output quality.
Practical guidance. Running LLM-as-a-judge and code checks together gives you the broadest coverage. Use code checks for known failure patterns where speed matters, and use LLM-as-a-judge for open-ended quality review where the failure mode is harder to specify in advance. Neither method replaces human review for high-stakes outputs, but both reduce the volume of traces a human needs to inspect.
When You Need Agent Governance, Not Just Monitoring
Monitoring tells you what happened. Governance controls what agents are allowed to do before a failure occurs.
The three tools above track failures, trace spans, and score outputs. None of them enforce which data sources an agent can reach, block a tool call that violates a policy, or give you visibility across agent-to-agent communication at runtime. For enterprises where agents are already making decisions autonomously, that gap is a risk to address now, not a roadmap item.
Trust3 AI is an enterprise platform that discovers every AI agent running across your environment, observes every prompt, tool call, and decision those agents make, and enforces purpose-based access controls on the data and tools agents can reach. It covers MCP servers, A2A communication, APIs, and underlying data sources from build time through runtime, across any agentic framework.
Prices and plan limits verified as of November 2026.
FAQs
What are the best open-source LLM observability tools?
Langfuse is an open-source option for LLM observability. Its MIT-licensed core lets you self-host the entire platform, keeping prompt data and traces inside your own infrastructure. It covers prompt versioning, span-level agent tracing, annotation queues, and both LLM-as-a-judge and code-based evaluation workflows. For teams that need open-source control without building a tracing layer from scratch, it is the practical starting point.
What are the costs associated with LLM monitoring?
Costs vary by deployment model. Langfuse and Sentry both sit at budget-tier price points. Dynatrace with Arize AX targets enterprises and carries a premium price tier. Self-hosting any tool shifts cost from subscription fees to infrastructure, maintenance, and engineering time. Sentry’s advanced AI investigation capability requires a pricier per-contributor add-on beyond the base plan.
Can LLM monitoring tools integrate with local or self-hosted models like Ollama?
Yes, with varying levels of effort. Langfuse’s open-source core runs inside your own infrastructure, so you control which model endpoints are traced. Arize AX uses OpenInference and OpenTelemetry standards, which are framework-agnostic and work with local models. Sentry captures spans at the application layer, though you should verify current support for your specific local runtime directly with Sentry.
What is the difference between LLM tracing and LLM evaluation?
Tracing records what happened: which prompts were sent, what the model returned, how long each step took, and which tools were called. Evaluation judges whether what happened was good: it scores outputs against a rubric, flags factual drift, or checks whether a response met a structural requirement. Tracing is the data collection layer; evaluation is the quality layer built on top of it. You need both to catch failures reliably, because a trace tells you a response was generated but not whether it was correct.
How do LLM monitoring tools attribute token costs to specific users or features?
Cost attribution works by tagging spans with metadata at instrumentation time. You attach a user ID, feature name, or workflow label to each trace, and the monitoring tool aggregates token counts and associated costs against those tags. Langfuse and Arize AX both support this pattern [T1, T2]. Verify current cost attribution capabilities directly with each vendor before committing to a production setup. Verify current cost attribution capabilities directly with each vendor before committing to a production setup. The accuracy of attribution depends entirely on how consistently your team applies tags when instrumenting model calls.
Conclusion
Langfuse, Sentry, and Dynatrace with Arize AX each solve a different version of the LLM monitoring problem. Langfuse fits teams that need open-source prompt tracing and evaluation control. Sentry fits teams that want LLM visibility inside an existing error monitoring workflow. Dynatrace with Arize AX fits enterprises that need automated root-cause analysis across a complex, multi-service environment.
Before choosing, identify your primary failure mode: quality degradation, production errors, or cost overruns. Match the tool to that failure mode first, then check whether its deployment model fits your data residency and infrastructure constraints. If monitoring alone is not enough and you need runtime controls over what your agents can access and do, that is the point to look beyond observability tools and into agent security and governance capabilities.
Related Articles